Failure anticipation
Continuous tracking of variables helps teams identify deviations before they evolve into shutdowns or equipment damage.
Digital Platforms
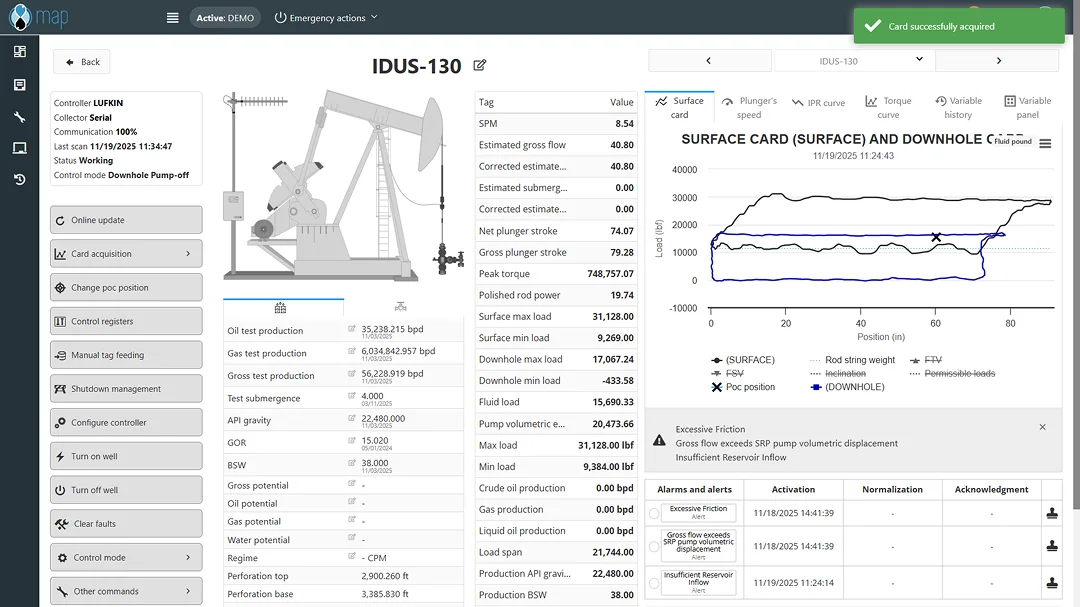
Monitoring and management of onshore wells on a single platform
Track operational variables, alarms, equipment and lift methods in a centralized environment, with analysis capabilities and remote actuation.
Context
Operations with many wells generate large volumes of information distributed across controllers, equipment and field teams. When this data is not centralized, identifying deviations, failures and intervention opportunities takes time and increases team exposure.
MAP brings this information together in a single interface, with analyses specific to artificial lift and remote control capabilities.
Benefits
Continuous tracking of variables helps teams identify deviations before they evolve into shutdowns or equipment damage.
Monitoring and remote control reduce the need for on-site checks and lower field team exposure.
Process data, alarms, equipment condition and analyses are available in the same environment, without switching systems.
The team tracks wells with different lift methods in an organized way, with the same reading standard.
Interactive scenario
Follow a producing well and simulate a shutdown to see how downtime turns into non-produced volume and potential economic impact.
Stopped
Current production
0bbl/d
Simulated production: 30 bbl/d
Reference barrel price
Fetching updated reference...
Simulated times
Time accelerated for the demo: 1 s = 10 min of operation
Well BM-01
Production and estimated loss
Comparison between the estimated gross production value and the estimated loss caused by the shutdown.
Produced volume
0.0bbl
Estimated gross production value
$0.00
Estimated lost volume
0.0bbl
Estimated downtime loss
$0.00
Waiting for the reference price to start the simulation.
Illustrative scenario with simulated data representing an operating condition of a rod-pumped well.
Illustrative estimate based on the simulated volume and the reference barrel price. It does not represent net revenue or an accounting financial loss, and does not consider costs, royalties, taxes, oil quality or commercial conditions.
In focus
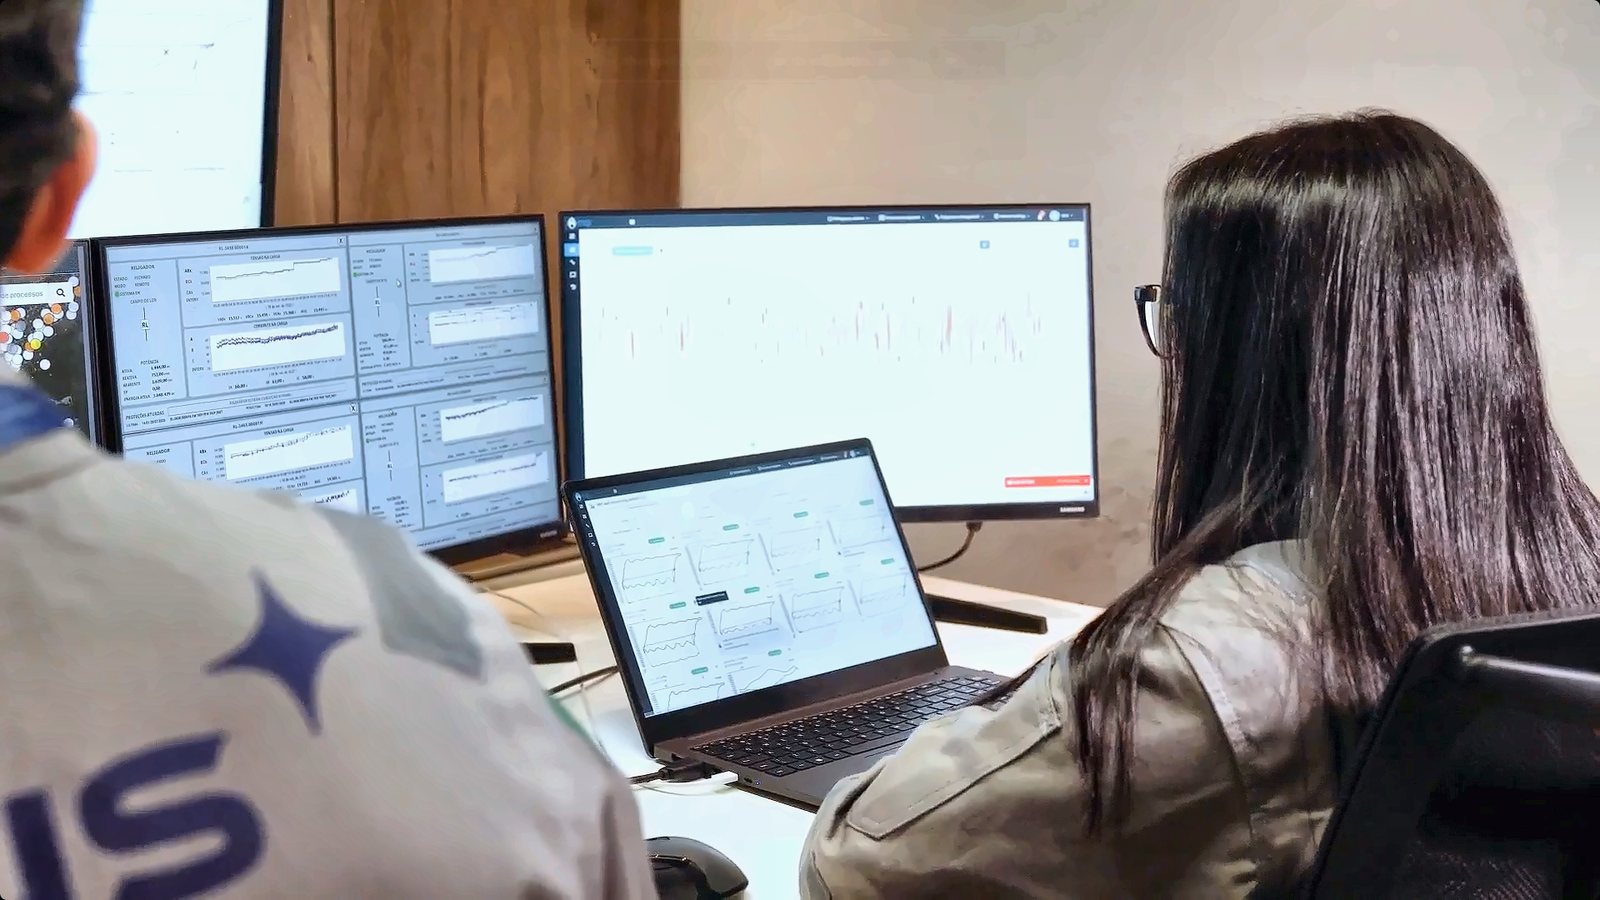
Dynamometer cards, IPR analysis and torque tracking help explain the behavior of each well. Instead of looking only at an out-of-range value, the team understands what is happening downhole.
In focus
With the well connected to the platform, part of the interventions can be carried out remotely. This reduces the time between identifying an abnormal condition and responding to it.
Capabilities
MAP tracks wells running different artificial lift methods in a single platform, without being restricted to one type of operational setup.
The platform communicates with different types and makes of well controllers, making it easier to integrate with the infrastructure already in place.
Process variables, equipment status and operational condition of each well, updated continuously.
Send commands to wells and equipment directly from the interface, according to defined permissions.
Other features
Application
MAP receives information from well controllers and equipment and centralizes the operation in a single interface. The team tracks variables, alarms and operational conditions, consults the available analyses and, when applicable, acts remotely on the well.
Business value
When the operation depends on dozens or hundreds of assets distributed across the field, centralizing information reduces the time needed to understand what is happening at each well. MAP brings data, analysis and control closer to the team responsible for the operation and helps direct interventions with more context.
Talk to the IDUS team to assess your wells' scenario and the platform's application possibilities.
Talk to IDUSKeep exploring
Industrial alarm management
Alarm health indicators on top of any supervisory system. Out of the spreadsheet, into ISA-18.2.
Explore LAMData integration and automation
Industrial ETL. It extracts, treats and delivers field data to whoever needs to decide.
Explore LDIIntelligence applied to industrial data
Data science platform for industry. It centralizes scattered information and generates specialized alerts.
Explore Camális